AI VISIBILITY INDEX
Methodology
overview
To understand how the major AI search platforms create responses and recommend brands, we analyzed Semrush's database of more than 126 million real US AI search prompts, covering ChatGPT, Google AI Mode, Google AI Overview, and Gemini. From this, we extracted the most mentioned brands and most cited domains across 22 industries.
- Business & Professional Services
- Consumer Electronics
- Digital Technology & Software
- Fashion & Apparel
- Finance

The prompt dataset
Our US prompt database has been curated, deduplicated, topic-organized prompts sourced from AI search clickstream data and Google’s keyword dataset for AI Overviews.
126 million prompts and growing
Best running shoes
Deduplicated with intent and semantics maintained
Best waterproof running shoes
Enhanced with Datos clickstream and Google AI Overviews keyword data
Best waterproof running shoes to buy
How we collected the data
Our dataset captures what real users are searching for across the four major AI platforms. The data comes from two complementary signals: clickstream data showing actual user interactions with AI search tools, and Google's AI Overview keyword dataset. Coverage spans ChatGPT, Google AI Mode, Google AI Overview, and Gemini, in the US.

What we measured
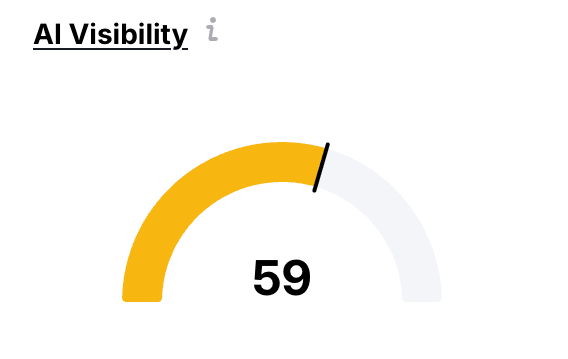
AI Visibility score
A Semrush metric that combines how often a brand shows up in responses with how consistently this is compared to other brands.

Mentions
When and how often brands appeared in the AI answers.
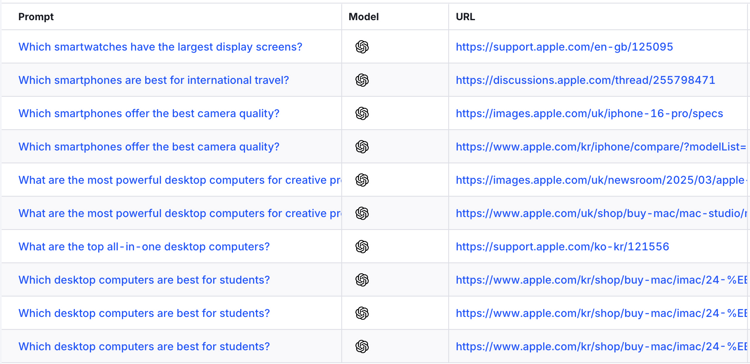
Citations
How often a domain is cited as a source in AI answers. Both raw citation counts and the share of all prompts a domain appears in.

Audience and topic volume
How much search demand sits behind each topic where a brand or source appears, for a weighted view of visibility.
How we ranked results
Each chart clearly states the metric used (mentions, citations, or similarity). For cross-platform comparisons, we present results separately for each of the four AI platforms rather than combining them into a single weighted score, because the four platforms behave differently enough that aggregation would hide insights. Where appropriate, we use rank correlation (Spearman) to measure how closely two platforms agree on brand and source rankings.
Managing variability
Because AI responses can change from day to day, we collected data over longer timeframes and averaged the results to ensure consistency.

Explore our latest research
Download our AI Visibility
Reports & Playbooks
Explore a deeper analysis and get actionable strategies on how to win in AI search.
Download for free